


Research Article - Oxidants and Antioxidants in Medical Science (2021)
Effect of Mixed Aqueous Extracts of Allium Sativum, Annona Muricata and Cymbopogon Citratus Leaves on the Blood Glucose and Lipid Profile of Hyperglycemic Rats
Ijioma Okorie*, Chiemela Goodluck Ndubuisi, Amarachi Ihedinachi Onwuchekwa, Raymond Ade Adesanmi and Ngozi Nnam2Department of Food Science and Technology, University of Nigeria Nsukka, Nigeria
3Ekiti State Primary Health Care Development Agency, Nigeria
4Department of Nutrition and Dietetics, University of Nigeria Nsukka, Nigeria
Ijioma Okorie, Department of Human Nutrition and Dietetics, Michael Okpara University of Agriculture Umudike, Nigeria, Email: okorie.ijioma@mouau.edu.ng
Received: 03-Aug-2021 Published: 24-Aug-2021
Abstract
The study was on the effect of mixed aqueous extracts of A. sativum, A. muricata and C. citratus, leaves on the blood glucose and lipid profile of hyperglycemic rats. The study adopted experimental study design where 15 adult male Albino rats were assigned randomly to 2 treatment groups and 1 non-treatment group, 5 rats in each group. The leaves were harvested and processed into aqueous extract using standard method. 1 g each of the extracts was dissolved in 10 ml of distilled water to make a stock of 100 mg/ml of extract. Alloxan was used to induce hyperglycemia in rats. Treatment commenced once diabetes was established and lasted for 21 days. Blood glucose level and lipid profile were evaluated using standard methods. Statistical tool (ANOVA and DMRT) was carried out, while percentage difference was used to determine study effect. The result revealed that the initial glucose level of the rats ranged from 57.80- 69.60 mg/dL, their blood glucose level after induction ranged from 253.20-293.20 mg/dL. There was 14.93%, 19.19% and 25.43% fall on days 7, 14 and 21, respectively, in the blood glucose levels of the rats after treatment with mixed aqueous extracts of the leaves, while with antidiabetic drug showed 15.14%, 25.17% and 61.19% decline on same days. The LDL level showed 80.4% fall, while 28.8% increase in the HDL level of the rats treated with mixed aqueous extracts of the leaves. Mixed aqueous extracts thus, is useful in anti-hyperglycemic and anti-hyperlipidemic activity, and managing type 2 diabetes mellitus.
Introduction
The search for cost effective strategy using therapeutic and/or medicinal plants in the mitigation of hyperglycemia has continued, due to its effect and associated comorbidities in the human body. Diabetes mellitus especially type 2 diabetes has become rampart in African countries especially in sub-Saharan Africa. The number of adults approximated to be diabetic in sub-Saharan Africa (SSA) was 15.5 million in the year 2017, identifying a regional prevalence at 6% and the cost healthcare rose to USD 3.3 billion. The projection showed that by the year 2045, there expected about 162.5%, totaling up to 40.7 million type 2 diabetic adults, with costs further risen to USD 6 billion [1,2]. The incidence of hyperglycemia and often leading to hyperlipidemia, have increased markedly in the past decades as a result of obesity, inactivity and ageing population, with high risk of vascular comorbidities including coronary artery disease, and physical inactivity and impaired cognitive function and mortality [3]. Diabetes mellitus has been reported to be a chronic disease because of inherited autoimmune and/or acquired inadequate pancreatic insulin production and insulin resistance [4]. Hyperglycaemia and glucosuria were the commonest and earliest indices used to diagnose diabetes mellitus. Therefore, the abnormal metabolism of carbohydrate in diabetes and characteristic glycolytic pathway profound adjustment, leads to activating alternative metabolism in polyol pathways, resulting in the accumulation of intracellular sorbitol [5]. These alterations in metabolism have been indicated in the aetiology of diabetic peripheral neuropathy, cataracts and retinopathy [6,7].
Therefore, the treatment, cure and/or management of type 2 diabetes mellitus have led to the investigation of the medicinal and therapeutic potentials of plant origin that will aid in cost-effective strategy. Several studies on individual plants have reported significant effect in lowering high blood glucose levels, total cholesterol, triglyceride and low density lipoprotein levels in both alloxan and streptozotocin induced diabetic rats. A study by Okorie et al. [3] showed a relative decline in the blood glucose levels of treated diabetic rats from 303.20 mg/dL after induction to 210.80 mg/dL after 21 days treatment with aqueous extract of Allium sativum leaves at dose 400 mg/kg body weight. Significant decrease was observed in the serum lipid profile in treated diabetic rats after treatment with aqueous extract of garlic leaf, except for high density lipoprotein cholesterol which had significant increase [8]. Sawant and Dongre [9] reported that nutrients in A.muricata leaves were seen to stabilize and/or normalize blood glucose level to normal range that is useful in managing diabetes mellitus. Adeyemi, Komolafe, Adewole and Obuotor [10] reported significant decreased in the total cholesterol, triglyceride, low density lipoprotein and very low density lipoprotein after treatment with extract of Annona muricata leaves at 100 mg/ kg. Aqueous suspension of lemongrass was found to have anti-hyperglycaemic effect by decreasing blood glucose level, reducing liver and renal damage due to alloxan-induced diabetes and thus, could restore activities of certain liver enzymes to normal level [11].
However, there exists little or no information on the mixed and/or combination of two or more individual plants extracts (both aqueous and ethanol) and the effect on hyperglycemia and hyperlipidemia. The study was carried out to investigate the effect of mixed A. sativum leaves, A. muricata leaves and C. citratus leaves on the blood glucose and lipid profile of hyperglycemic rats.
Materials and Methods
Experimental study design was used to investigate the effect of aqueous extracts of C. citratus, A. sativum and A. muricata leaves on the blood glucose and lipid profile of hyperglycemic rats. In this study design, 15 adult male Albino rats were assigned completely at random to two different treatment groups and one non-treatment group, making 5 rats in each group. However, each experimental unit had the same chance of receiving treatment for those in treatment groups. The animals (rats) were weighed individually and the ones with similar body weight were put in the same experimental unit homogenously. The 3 different groups were diabetic groups, where one group was treated with mixed aqueous extracts of C. citratus, A. sativum and A. muricata leaves, another group treated with antidiabetic drug (Glibenclamide) and the last group received distilled water. Administration was done orally with the aid of intra-gastric tube attached to a syringe for a period of 21 days after induction.
Experimental materials
Fresh leaves of C. citratus, A. sativum and A. muricata were harvested from a home garden in Abuja, and identified in the Department of Plant Science and Biotechnology, University of Nigeria Nsukka, Enugu State, Nigeria. Fifteen (15) male albino wistar rats were purchased from the Faculty of Veterinary Medicine, University of Nigeria Nsukka, while the chemical (alloxan) that was used to induce diabetes in the rats was purchased from a chemical shop in Nsukka, Enugu State, Nigeria.
Preparation of the plant materials
The method described by Sukhder et al. [12] was adopted for extraction of the leaves with little modification. Freshly harvested C. citratus, A. sativum and A. muricata leaves were sorted, washed and air dried at ambient temperature for 3 days. The leaves were chopped into small pieces and then milled to fine powder, ready for further treatment. One hundred and fifty grams (150 g) each of the powdered leaves were immersed in 4500 ml of distilled water and agitated on a mechanical shaker for 30 minutes. The mixtures were allowed to stand for 5 hours and then drained using a muslin cloth into a 5 L dry stainless steel bowl. The liquid extracts were concentrated to dryness in a Gallenkamp hot air oven (Size One Oven BS) at 60°C until a gummy extract was obtained. The gummy extracts (concentrates) were then recovered into sample bottle and stored in the refrigerator until use for further analysis and study. One gram (1 g) each of the extracts (C. citratus, A. sativum and A. muricata) was dissolved in 10 ml of distilled water to make a stock of 100 mg/ml of extract. The volume of extract to be administered will be determined using the formula:

Acute toxicity test of aqueous extracts of C. citratus, A. sativum and A. muricata leaves
This was done to evaluate the toxicity of the various leaves and their lethal dose to be used for the study. The method described by Lorke [13] was adopted for the acute toxicity test of the aqueous extracts of C. citratus, A. sativum and A. muricata leaves. 54 albino mice were used in the toxicity study, giving 18 mice for each sample. The test involved two stages. In stage one, the animals were grouped into 3 groups of three mice each and were given 10, 100, and 1000 mg/kg body weight of the extracts respectively. In stage two, 1600, 2900 and 5000 mg/kg body of the extracts weight were administered to the mice respectively. The administration of the extracts was done orally. Therefore, acute toxicity test of the aqueous extracts of the various leaves revealed no death up to a dose 5000 mg/kg body weight, as shown in Table 1.
| Phase I | Dosages (mg/kg body weight) | Mortality |
|---|---|---|
| Group 1 (C. citratus) | 10 | 0/3 |
| Group 2 | 100 | 0/3 |
| Group 3 | 1000 | 0/3 |
| Group 1 (A. sativum) | 10 | 0/3 |
| Group 2 | 100 | 0/3 |
| Group 3 | 1000 | 0/3 |
| Group 1 (A. muricata) | 10 | 0/3 |
| Group 2 | 100 | 0/3 |
| Group 3 | 1000 | 0/3 |
| Phase II | Dosages (mg/kg body weight) | Mortality |
| Group 1 (C. citratus) | 1600 | 0/3 |
| Group 2 | 2900 | 0/3 |
| Group 3 | 5000 | 0/3 |
| Group 1 (A. sativum) | 1600 | 0/3 |
| Group 2 | 2900 | 0/3 |
| Group 3 | 5000 | 0/3 |
| Group 1 (A. muricata) | 1600 | 0/3 |
| Group 2 | 2900 | 0/3 |
| Group 3 | 5000 | 0/3 |
Experimental animals
Healthy male albino rats weighing (126 g-152 g) were procured from the Faculty of Veterinary Medicine University of Nigeria Nsukka Enugu State Nigeria. The experiment was performed according to the principles in the guide for the care and use of labouratory animals described by the National Institute of Health. The experimental protocol was made to conform to the rules for ethical conduct within the animals use and care. Ethical clearance was sorted and obtained from the Animal Care and Use Committee, Faculty of Veterinary Medicine, University of Nigeria Nsukka. The rats were placed and/or housed in a plastic group cage and in atmospheric temperature (25°C ± 2°C) with a relative humidity (45% ± 5%) in 12 hours light and 12 hours dark condition in a modern private animal house located at Ukwuoho, Orba road Nsukka within the Univeristy of Nigeria Nsukka. The rats were given standard pellet diet and water ad libitum, while the rats were allowed to acclimatize to the new environmental condition.
Experimental induction of diabetes mellitus
An established quantity of alloxan (100 mg/kg body weight) by Okorie et al. [3] used to induce diabetes was adopted in the study. More so, the method described by Okorie et al. [3] was adopted to induce diabetes using alloxan. The adult rats were kept on 18 hours fast in order to induce diabetes. The induction was done intraperitoneally using alloxan (Sigma Aldrich, St Louis, MO, USA). The rats were divided and labelled appropriately into 3 groups of 5 rats each as indicated earlier. The weight of the individual animals in each of the groups was used to calculate the volume of alloxan used in the induction process. The adopted quantity of alloxan (100 mg/kg) was used, that is, 1 g (1000 mg) of alloxan dissolved in 10 ml of distilled water to obtain 100 mg/ml. Therefore, after 2 days of induction, blood samples of the individual animals were drawn from their tail to confirmed diabetes, and thereafter, treatment commenced across the different groups with specific treatment doses as designed for each group. The different extracts were reconstituted using 1 g of each extract dissolved in 10 ml of distilled water to obtain 100 mg/ml, and this (100 mg/ml) was used to calculate the actual volume given to individual rats throughout the study period. The treatments were administered orally using intra gastric tube (attached to a syringe) for 21 days after establishment of diabetes mellitus, while the animals (rats) were fed normally and water ad libitum.
Treatment groups
Group 1: Diabetic rats treated with mixed/combined aqueous extracts of C. citratus, A. sativum and A. muricata leaves at 300 mg/kg body weight
Group 2: Diabetic rats treated with antidiabetic drug at 500 μg body weight
Group 3: Diabetic rats distilled water no treatment with extracts or drug
Evaluation of biochemical parameters
Collection of blood: The blood sample of the rats was collected from the recto bulbar plexus (in the eye). The blood sample was allowed to clot for about 1 hour and then centrifuge at 3000 rpm. Thereafter, the serum was collected, stored and used for further analysis of the lipid profile of the rats.
Blood glucose determination: Blood glucose estimation was done for the individual rats using Accu-Chek glucometer commercial kit, in the following order: initial blood glucose, blood glucose level after induction, blood glucose level on day 7, blood glucose level on day 14 and blood glucose level on day 21.
Lipid profile: The baseline and end line of the lipid profile of the rats were determined using the serum.
Determination of cholesterol
The method described by Abell et al. [14] was adapted for the present study.
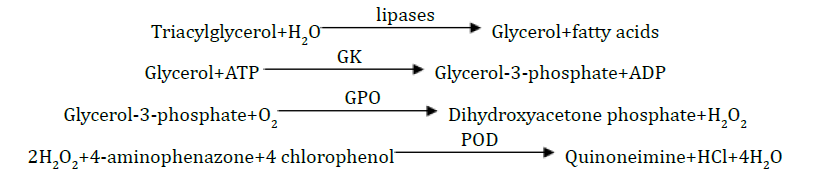
Principle: Cholesterol was determined after enzymatic hydrolysis and oxidation. The indicator quinoneimine was formed from hydrogen peroxidase and 4 aminoantipyrine in the presence of phenol and peroxidase.
Test procedure: 3 test tubes were set up in a test tube rack and labeled blank, standard and sample respectively. To the blank, 10 μl of distilled water was added; 10 μl standard specimens was added to the standard test tube, while 10 μl samples (serum) were added to the sample test tube. However, 1000 μl of the cholesterol reagent was added to the three (3) test tubes. Each of the samples were thoroughly mixed and incubated for 10 minutes at room temperature (20°C-25°C). The absorbance of the samples (A sample) against the blank was taken within 60 minutes at 500 nm. Total cholesterol (mg/dl)=Absorbance of sample/Absorbance of standard × 202.65
Low Density Lipoprotein (LDL)
Low density lipoprotein cholesterol was calculated using the following expression:
LDL-Cholesterol conc (mg/dl)=Total cholesterol (HDL+triglycerides/5)
High Density Lipoprotein (HDL)
Principle: Low and very low density lipoprotein (LDL and VLDL) was precipitated from serum by the action of a polysaccharide in the presence of divalent cations. Then, HDL that is present in the supernatant was determined.
Procedure: The precipitant solution 0.1 ml was added to 0.3 ml of the serum and mixed thoroughly and allowed to stand for 15 min. this was centrifuge at 2000 x g for 15 minutes. The cholesterol concentration in the supernatant was determined as described by Abell et al. [14].
HDL cholesterol (mg/dl)=Absorbance of sample/ Absorbance of standard x 202.65
Triacylglycerol
Principle: The triacylglycerol was determined after enzymatic hydrolysis with lipases. The indicator was quinoneimine formed from hydrogen peroxide, 4-aminophenazone and 4-chlorophenol under the catalytic influence of peroxidase.
Data and Statistical analysis
Glucose, total cholesterol, LDL, HDL, VLDL, TAG levels were also analyzed and compared with the standard (normal range) for rats. Statistical comparisons between experimental groups were performed using one way analysis of variant (ANOVA) while pairwise comparisons among groups were carried out using Duncan Multiple Range Test (DMRT). Statistical analysis was performed using IBM-SPSS version 21. A level of P<0.05 was considered significant.
Results
Table 2 shows the blood glucose of the rats across the groups. The initial blood glucose of the rats in various groups ranged from 57.80 mg/dL to 69.60 mg/dL. The mean values of the initial glucose level (IGL) of the rats in various groups were 69.60 mg/dL, 63.80 mg/dL and 57.80 mg/dL, respectively, mixed aqueous extracts of garlic leaf+soursop leaf+lemongrass at 300 mg/kg (G+S+L300 mg/kg) standard drug at 500 μg (SD500 μg), and diabetic no extract (DNE). The blood glucose level after induction (GLI) ranged from 253.20 mg/dL to 293.20 mg/dL, were the mean values the glucose level of the rats after induction included 253.20 mg/ dL (G+S+L300 mg/kg), 293.20 mg/dL (SD500 μg) and 259.60 mg/dL (DNE).
| Group | IGL (mg/dl) | GLI (mg/dl) | GL7D (mg/dl) | % D | GL14D (mg/dl) | % D | GL21D (mg/dl) | % D |
|---|---|---|---|---|---|---|---|---|
| G+S+L300mg/kg | 57.80 ± 10.78 | 253.20 ± 31.43 | 215.40 ± 40.97 |  -14.93 -14.93 |
204.60 ± 41.76 | -19.19 |
188.80 ± 188.66 | -25.43 |
| SD500µg | 69.60 ± 14.54 | 293.20 ± 24.01 | 248.80 ± 16.39 | -15.14 |
219.40 ± 8.68 | -25.17 |
113.80 ± 9.76 | -61.19 |
| DNE | 66.80 ± 7.92 | 259.60 ± 21.51 | 308.40 ± 33.36 |  18.8 18.8 |
237.40 ± 134.34 | -8.55 |
159.40 ± 148.49 | -38.6 |
| IGL = initial glucose level; GLI = glucose level after induction; GL7D = glucose level after 7 days; GL14D = glucose level after 14 days; GL21D = glucose level after 21 days; G+S+L = garlic, soursop, lemongrass; SD = standard drug; DNE = diabetic no extract; % D = percentage difference;Â Â Â = increase;Â Â Â = decrease. |
||||||||
There was decrease in the blood glucose levels in diabetic treated rats (253.2 ± 31.43 to 188.8 ± 188.66 mg/dl) after treatment with mixed aqueous extracts of G+S+L at 300 mg/kg. There were significant percentage fall (14.93%, 19.19% and 25.43%) on day 7, day 14 and day 21 in the blood glucose levels of the treated diabetic rats, and thus, bringing blood glucose level from 253.2 mg/dl to 188.8 mg/dl, although a little above normal range for rat. However, Table 2 also showed the result of treatment on diabetic rats with standard diabetic drug (glibenclamide) at 500 μg. Significant fall in blood glucose levels of diabetic treated rats were observed (293.2 ± 24.01 to 113.8 ± 9.76 mg/dl) after treatment with glibenclamide at 500 μg. There was significant percentage decrease (15.14%, 25.17% and 61.19%, respectively) in the blood glucose level of treated diabetic rats after treatment on day 7, day 14 and day 21. However, on day 21 the blood glucose level came down to normal (113.80 mg/dl) from 293.20 mg/dl after induction with alloxan. More so, in diabetic rats with no treatment given, there was 18.8% increase in the blood glucose level from 259.60 mg/dl to 308.40 mg/ dl on day 7 after induction with alloxan. However, there was decrease in the blood glucose level to 237.4 mg/dl and 159.4 mg/dl on day 14 and day 21, respectively. This showed 8.55% and 38.60% fall in the blood glucose levels both on day 14 and day 21, respectively, in the non-treated diabetic rats.
Table 3 reveals the baseline (after inducing diabetes) and end line levels of total cholesterol (TC) and triglyceride (TAG) of treated and non-treated diabetic rats. There were significant decreases in TC and TAG levels were seen in treated diabetic rats (67.56 ± 19.23 to 47.52 ± 22.88 mg/dl and 84.16 ± 41.75 to 73.78 ± 46.20 mg/dl, respectively) after treatment with mixed aqueous extracts of A. sativum, A. muricata and C. ciratus at dose 300 mg/kg body weight. This further revealed about 29.7% and 12.3% fall, respectively, of the TC and TAG levels of the treated diabetic rats on day 21. Furthermore, treatment with standard diabetic drug (glibenclamide) at dose 500 μg revealed 39.4% and 21.6% decrease in the TC and TAG levels, respectively, of the treated diabetic rats on day 21, thereby, bringing down their TC level (65.00 ± 7.72 to 39.40 ± 7.52 mg/dl) and TAG level (71.40 ± 41.07 to 56.00 ± 44.04 mg/dl). There was also decrease in the TC and TAG levels of the non-treated diabetic rats (48.26 ± 3.02 to 16.26 ± 15.06 mg/dl and 69.68 ± 29.86 to 35.00 ± 36.87 mg/dl, respectively), which showed about 66.3% and 49.8% fall, respectively in their TC and TAG levels on day 21. There was also significant decrease in the LDL-C level (36.16 ± 9.11 to 7.08 ± 4.16 mg/dl) of the treated diabetic rats after treatment with mixed aqueous extract of A. sativum, A. muricata and C. citratus at dose 300 mg/kg body weight, which indicated 80.4% fall on day 21. The diabetic rats were also treated with standard diabetic drug at dose 500 μg, and this showed about 89.5% fall in the LDL-C level (34.76 ± 3.72 to 3.64 ± 2.04 mg/dl) of the treated diabetic rats at the end of the study, while the LDL-C level (31.30 ± 29.86 to 6.62 ± 7.40 mg/dl) of non-treated diabetic rats showed also about 78.8% fall at the end of the study. There was 28.8% increase in the HDL-C level (31.40 ± 12.09 to 40.44 ± 18.97 mg/dl) of the treated diabetic rats after treatment with mixed aqueous extracts of A. sativum, A. muricata and C. citratus at dose 300 mg/kg body weight at the end of the study, while treatment with standard diabetic drug at 500 μg revealed 18.3% increase in the HDL-C level (30.24 ± 6.09 to 35.76 ± 6.60 mg/dl) of the treated diabetic rats at the end of the study. However, significant percentage decrease (51.7%) was observed in the HDL-C level (19.96 ± 9.61 to 9.64 ± 9.68) of the non-treated diabetic rats at the end of the study.
| Groups | Total cholesterol (mg/dL) | %D | Triglyceride (mg/dL) | %D | ||
|---|---|---|---|---|---|---|
| Baseline | End-line | Baseline | End-line | |||
| G+S+L300mg/kg | 67.56 ± 19.23 | 47.52 ± 22.88 | ↓-29.7 | 84.16 ± 41.75 | 73.78 ± 46.20 | ↓-12.3 |
| SD500µg | 65.00 ± 7.72 | 39.40 ± 7.52 | ↓-39.4 | 71.40 ± 41.07 | 56.00 ± 44.04 | ↓-21.6 |
| DNE | 48.26 ± 3.02 | 16.26 ± 15.06 | ↓-66.3 | 69.68 ± 29.86 | 35.00 ± 36.87 | ↓-49.8 |
| G+S+L = garlic, soursop, lemongrass; SD = standard drug; DNE = diabetic no extract; % D = percentage difference; Â Â Â ↑= increase;Â Â Â ↓= decrease. |
||||||
| Groups | Low density lipoprotein (mg/dL) | %D | High density lipoprotein (mg/dL) | %D | ||
|---|---|---|---|---|---|---|
| Baseline | End-line | Baseline | End-line | |||
| G+S+L300mg/kg | 36.16 ± 9.11 | 7.08 ± 4.16 | ↓-80.4 | 31.40 ± 12.09 | 40.44 ± 18.97 | ↑28.8 |
| SD500µg | 34.76 ± 3.72 | 3.64 ± 2.04 | ↓-89.5 | 30.24 ± 6.09 | 35.76 ± 6.60 | ↑18.3 |
| DNE | 31.30 ± 29.86 | 6.62 ± 7.40 | ↓-78.8 | 19.96 ± 9.61 | 9.64 ± 9.68 | ↓-51.7 |
| G+S+L = garlic, soursop, lemongrass; SD = standard drug; DNE = diabetic no extract; % D = percentage difference; Â Â Â ↑= increase;Â Â Â ↓= decrease. |
||||||
Discussion
The term diabetes mellitus describes a metabolic disorder of multiple aetiology characterized by chronic hyperglycaemia with disturbances of carbohydrate, fat and protein metabolism that resulting from defect in insulin secretion, insulin action or both [15]. The initial blood glucose levels of the animals (rats) were within normal range before diabetes was induced. The chemical (alloxan) was used to induce diabetes mellitus in the rats.
In the present study, alloxan was used to induce diabetes. Diabetes mellitus was established amongst the rats after 48 hours alloxan induction, where the blood glucose level varied above 200 mg/dl. These variations in blood glucose level may have resulted due to the effect of the chemical (alloxan induced diabetes) on the individual animal response to partly the rate of apoptosis of cells of pancreas or their gene expression of insulin resulting in reduced insulin synthesis. Cells of pancreas normally maintain blood glucose concentration within a narrow range by modulating their insulin secretion rate in response to the blood glucose concentration [16]. However, apoptosis of pancreatic cells could be the primary factor which ultimately results in hyperglycaemia [17,16].
The rats in group 1, that were treated with mixed aqueous extract of A. sativum, A. muricata and C. citratus at dose 300 mg/kg body weight (G+S+L300 mg/ kg) revealed that combination of aqueous extracts of A. sativum, A. muricata and C. citratus leaves indicated lowering potentials by recording reduction in high blood glucose of the alloxan-induced hyperglycemic rats. These lowering effects of the mixed aqueous extracts of the leaves may be attributed to the presence of phytochemicals such as flavonoids and alkaloids, tannins, which may have contributed to the anti-hyperglycemic activity of the leaves. One would have thought that the mixed aqueous extracts of the leaves could have been the best in the hypoglycemic effect than the individual aqueous leave extracts in ameliorating high blood glucose levels in diabetic rats. However, the unstable activities of the mixed aqueous extracts to lower alloxan-induced hyperglycemia in rats may be attributed to nutrient and/or chemical interactions amongst the constituent phytonutrient and/or phytochemical of the various individual extract dosage, which could either be synergistic or antagonistic in exhibiting their various potentials and capacity to decrease elevated blood glucose level of diabetic rats, and thus, may have contributed to the rate of decline in the blood glucose levels of the treated hyperglycemic rats after treatment with mixed aqueous extracts of A. sativum, A. muricata and C. citratus leaves at dose 300 mg/kg body weight as observed in the study. The result therefore, corroborated with previous reports by Liu [18], Yoshimi, Keita, Fumihiko, Masahiro and Toshihiko [19], Milugo, Omosa and Ochanda [20] and Ojiako et al. [21] in their various studies on the effect of combination and/or mixed extracts on blood glucose level of alloxan-induced diabetic rats. However, when compared to treatment with standard antidiabetic drug (Glibenclamide) at 500 μg/kg body weight, the elevated blood glucose levels of the rats had a better outcome by mitigating high blood glucose levels to normal range, than the mixed aqueous extracts of the leaves, an indicative of its blood glucose lowering effects. Although, there was gradual decline in the elevated blood glucose in treated alloxan-induced hyperglycemic rats, the aim of the study on the effect of the mixed aqueous extracts of the leaves on blood glucose of hyperglycemic rats was thus achieved. More so, search for a cost effective strategy in ameliorating diabetes was also achieved as the leaves are very much available for use at a minimal and/or insignificant cost compared to cost of buying antidiabetic drug (Glibenclamide). Therefore, regular consumption of the leaves in meal plan would play an important role in lowering blood glucose levels. The decrease in the blood glucose of the non-treated diabetic rats suggested the effect of the diet fed to the rats, although their blood glucose levels were not within the normal range, it does suggest that appropriate diet both in quality and quantity could improve blood glucose level, and thereby, would play an important role in the management of type 2 diabetes mellitus.
The significant decrease in levels of TC, TAG and LDL-C obtained in the study were indicative of the potentials of mixed aqueous extracts of A. sativum leaves, A. muricataleaves and C. citratus to mitigate serum levels of these parameters and invariably increase serum levels of HDL-C compared to treatment with standard antidiabetic drugs. This therefore, suggests enhanced cardiovascular system of the treated alloxan-induced diabetic rats devoid of related disorders. This is in line with previous studies by Adeyemi and Akanji [22] and Sekh et al. [8]. Furthermore, Grover Paez and Zavalza Gomez [23] and Olukanni et al. [24] had earlier reported that elevated level of HDL-C is linked to reduced occurrences of cardiovascular disorder while increased level of LDL-C has been associated with higher risk of atherosclerosis. The mixed aqueous extracts of A. sativum, A. muricata, C. citratus at a dose of 300 mg/kg body weight had also a positive effect on the HDL-C level of the rats, which indicated anti-hyperlipidaemia activity of the mixed aqueous extracts.
Therefore, the normal and/or high ratio of HDL-C to LDL-C observed in the present study due to various treatment administered, could implicate reduced occurrences of cardiovascular disorder (atherosclerosis). However, the result of this study is in contrast with the study by Adeyemi and Orekoya [25] where the level of LDL-C was higher than HDL-C level of alloxan-induced diabetic rats after oral and repeated administration of their herbal mixture. This synthetic pathway plays a vital role in mitigating cholesterol levels in the blood and peripheral tissues as well inhibit formation of atherosclerotic plaque in the aorta [26-28]. Also, the present study is in conformity with the study by Ademuyiwa et al. [28] whereby the serum cholesterol levels were found to be down regulated after treatment. The display of synergistic effect by the mixed aqueous extracts in lowering hyperglycaemia could be depended upon the type and number of individual extracts involved in constituting the experimental doses. Thus, the mixture of the aqueous extracts may have contributed to the readjustment in the complete concentrations of the bioactive components and by extension may influence the nature and outcome of their interactions as observed in the study, in dictating dose dependent therapeutic potentials of the various aqueous leaves extracts.
Conclusion
Therefore, it can be inferred that the regular intake of the mixed aqueous extracts of C. citratus, A. muricata and A. sativum leaves have the capacity and potentials to lower high blood glucose (hyperglycaemia), hyperlipidemia and/or hypercholesterolaemia caused by alloxan-induced diabetes mellitus and more so, could have the ability to mitigate the complications of disorders of carbohydrate, protein and lipid metabolism, thereby enhancing insulin secretion.
Acknowledgment
We would like to thank Ijioma Okorie, Ngozi Nnam, Chiemela Goodluck Ndubuisi, Amarachi Ihedinachi Onwuchekwa and Raymond Ade Adesanmi for Designing the manuscript, Writing the manuscript, collecting the data and processing the final content.
References
- International Diabetes Federation (IDF). IDF Diabetes Atlas. Brussels: International Diabetes Federation 2017.
- Zimmermann M, Bunn C, Namadingo H, Gray CM, Lwanda J. Experiences of type 2 diabetes in sub-Saharan Africa: A scoping review. Glob Health Res Policy 2018;3:1-13.
- Okorie I, Adesanmi RA, Nnam N. Blood glucose and lipid profile of alloxan-induced hyperglycemic albino rats treated with aqueous extract of Allium sativum leaf. World J Pharma Res 2021;10:25-34.
- Yazdanparast R, Esmaeili MA, Helan JA. Teucrium polium extract effects pancreatic function of streptozotocin diabetic rats: A histopathological examination,â? Iranian Biomed J 2005;9:81-85.
- Williamson JR, Chang K, Frangos M, Hasan KS, Ido Y, Kawamura T. Hyperglycemia pseudo hypoxia and diabetic complications. Diabetes 1993;42:801-813.
- Jung M, Park M, Lee HC, Kang YH, Kang ES, Kim SK. Anti-diabetic agents from medicinal plants. Current Medicinal Chemistry 2006;13:1203-1218.
- Dewanjee S, Bose SK, Sahu R, Mandal SC. Antidiabetic effect of matured fruits of Diospyros peregrina in alloxan induced diabetic rats. Int J Green Pharma 2008; 2:95-99.
- Sekh AN, Bhupinder D, Rashmi K, Samar F, Mahmooduzzafar, Abdul M. Alliin obtained from leaf extract of garlic grown in situ conditions possess higher therapeutic potential analyzed in alloxan-induced diabetic rats. Pharma biol 2011;49:416-421.
- Sawant R, Dongre TP. Biochemical compositional analysis of Annona muricata: A miracle fruitâ??s review. Int J Pharma and Bioscie 2014;3:82-104.
- Adeyemi DO, Komolafe OA, Adewole SO, Obuotor EM. Anti hyperlipidemic activities of Annona muricata (Linn). Int J Alternat. Med 2008;7:2-7.
- Atiku MK, Adamu DJM, Gadanya AM, Shehu MA. The effect of â??gadagiâ? tea on liver function and serum glucose concentration in albino rats. Bayero J Pure and App Sci 2009;2:125-128.
- Sukhdev SH, Suman PSK, Gennaro L, Dev DR. Extraction technologies for medicinal and aromatic plants 2008.
- Lorke D. A new approach to practical acute toxicity testing. Arch Toxicol 1983;54:275-287.
- Abell LL, Levy BB, Brodie BB, Kendall FE. A simplified method for the estimation of total cholesterol in serum and demonstration of its specificity. J Bio Chem 1952;195:357-366.
- World Health Organization (WHO). Definition, diagnosis and classification of diabetes mellitus and its complications. Part 1: Diagnosis and classification of diabetes. WHO/NCD/NCS, Geneva 1999.
- Husni A, Wijayanti R, Ustadi. Inhibitory activity of a-Amylase and a-Glucosidase by Padina pavonica extracts. J Biol Sci 2014;14:515-520.
- Patel R, Shervington A, Pariente JA, Martinez Burgos MA, Salido GM, Adeghate E, Singh J. Mechanism of exocrine pancreatic insufficiency in stretozotocin-induced type 1 diabetes mellitus. Ann N Y Acad Sci 2006;1084:71-88.
- Liu RH. Health benefits of fruits and vegetables are from additives and synergistic combinations of phytochemicals. Am J Clin Nutr 2003;78:517-520.
- Yoshimi N, Keita S, Fumihiko Y, Masahiro K, Toshihiko O. Extensive screening for herbal extracts with potent antioxidant properties. J Clin Biochem Nutr 2011;48:78-84.
- Milugo TK, Omosa LK, Ochanda JO. Antagonistic effect of alkaloids and saponins on bioactivity in the quinine tree (Rauvolfia caffrasond): further evidence to support biotechnology in traditional medicinal plants. BMC Complement Altern Med 2013;13:285.
- Ojiako OA, Chikezie PC, Ogbuji AC. Blood glucose level and lipid profile of alloxan-induced hyperglycemic rats treated with single and combinatorial herbal formulations. J Tradit Complement Med 2015;6:184-192.
- Adeyemi OS, kanji MA. Iron and nitric oxide play key role in the development of cardiovascular disorder. Journal of Toxicology and Environmental Health Science 2011;3:249-253.
- Grover Paez F, Zavalza Gomez AB. Endothelial dysfunction and cardiovascular risk factors. Diabetes Res Clin Pract 2009;84:1-10.
- Olukanni OD, Akande OT, Alagbe YO, Adeyemi OS, Olukanni AT, Daramola GG. Lemon juice elevated level of reduced glutathione and improved lipid profile in Wistar rats. American-Eurasian J Agricult & Environ Sci 2013;13:1246-1251.
- Adeyemi OS, Orekoya BT. Lipid profile and oxidative stress makers in Wistar rats following oral and repeated exposure to Fijk herbal mixture. J Toxicol 2014.
- Karmarker B. Polaxamers and their applications in pharmacy student articles 2008.
- Kim H, Jeong D, Jung H, Yokozawa T, Choi J. Hypolipidemic effect of Sophora flavescens and its constituents in poloxamer-407-induced hyperlipidemic and cholesterol-fed rats. Biol Pharm Bull 2008;31:73-78.
- Ademuyiwa AJ, Usunomena U, Olubunmi G, Iyere OO. Comparative studies on the effect of extracts of Cymbopogon citratus (lemongrass) on the lipid profile of Wistar Albino rats. World J Pharma Res 2016;5:141-150.